|
Welcome! |
[Home] [PMWIN] [3D Visualization] [ASMWIN] [Downloads] [Links] |
|
|||
| by Wen-Hsing Chiang | Last Update: April 15, 2011 | ||
|
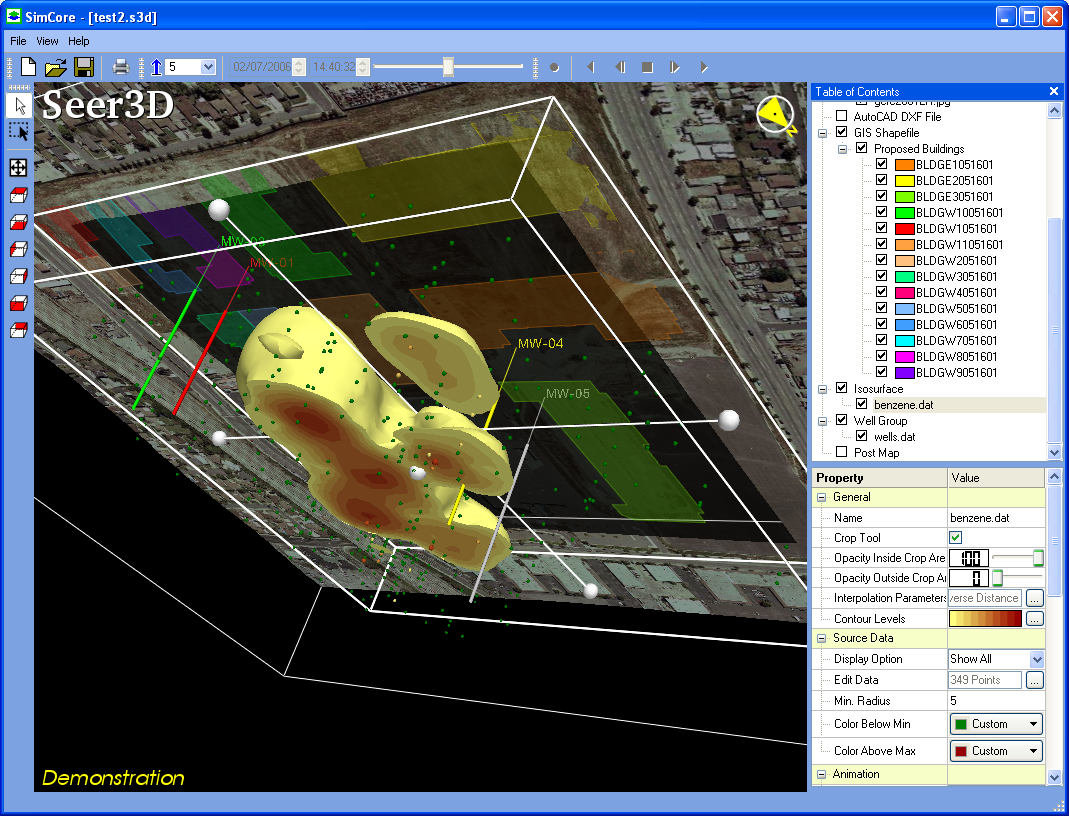
Books and computer software applications that I have co-authored are shown to the right. Click the images for more information. |
|
|
|
|
|
|
|
|
|
June 2010: Processing Modflow 8 is released. Visit www.simcore.com for details. |
|
|
Summer 2005: The second edition of the popular book "3D-Groundwater with PMWIN" is published by Springer and is available on most major bookstores. |
|
|
Spring, 2005: PMWIN (version 5.3), which is included in the first edition of the book "3D-Groundwater Modeling with PMWIN", is now freeware. |
|
|
Winter 2004: A Tradinational-Chinese translation of the book "3D-Groundwater Modeling with PMWIN" is published. Click here for details. |
|
|
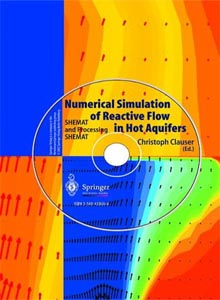
Fall 2003: The book "Numerical Simulation of Reactive Flow in Hot Aquifers" is published by Springer Verlag. The book deals with the numerical simulation of reactive transport in porous media using the simulation package SHEMAT and Processing SHEMAT. The latter is based on the version 5.0 of Processing Modflow. SHEMAT (Simulator for HEat and MAss Transport) is an easy-to-use, general-purpose reactive transport simulation code for a wide variety of thermal and hydrogeological problems in two or three dimensions. The enclosed companion CD-ROM contains the software and data for all of the case studies. |
|
|
|
|
|
| © Copyright 1995-2009. Wen-Hsing Chiang | ||